


Newsletter
Why Clay ditched LTV:CAC (and you should too)
The SaaS metric everyone swears by has a dirty secret. Here’s one CFO's solution that actually works.
Note from the author
If you've raised venture money in the last decade, you've probably pitched LTV to CAC ratios with the confidence of someone reading scripture. The math seems bulletproof: customers pay you X over their lifetime, you spend Y to acquire them, and if X is bigger than Y, you print money.
Except Karan Parekh, CFO at Clay ($3.1B), thinks this is mostly nonsense.
And after seeing how LTV to CAC burned investors (and operators) during the 2022 correction, he might be onto something.
Today’s key takeaways
LTV to CAC: Where it fails & what to do about it
Action audit: Start testing Clay’s metric
Hot link: US considers buying stake in Intel
Chart: Fed rate cut probabilities
📉 The LTV to CAC trap that caught everyone

Here's the uncomfortable truth about LTV to CAC: it's built on assumptions that rarely survive contact with reality.
When you calculate a 10-year customer lifetime value, you're betting that your customer will stick around for a decade. You're also betting that your business model, competitive landscape, and economic environment stay roughly the same.
"Most companies have something dramatic change for them over the course of five or 10 or 20 years," Karan explains. "There might be an economic cycle where you lose a bunch of your customers because they go out of business. You might be operating a call center and you didn't know that OpenAI was going to come out."

Think about the meal kit companies, subscription boxes, and other "high LTV" businesses that imploded when their retention assumptions proved wrong. Or consider how many SaaS companies discovered their "sticky" customers weren't so sticky when budgets tightened in 2022.
The second problem? Most LTV calculations conveniently forget about the ongoing costs of serving customers, like $10 of support, $15 of promotions, and $4 of payment processing.
Clay's alternative: Year one gross profit to CAC

Instead of gambling on distant future cash flows, Clay measures something much harder to mess up: year one gross profit relative to customer acquisition cost.
"In our case, many of our customers actually pay and commit a one-year contract when they sign up with us," Karan notes. "So we have near certainty on how much they're going to pay us over the first year."
Karan doesn’t need the CAC to be paid back in one year relative to gross profit. He says the beauty of this approach is mathematical simplicity:
If it's 50%, you know you need two years to pay back acquisition costs
If it's 25%, you need four years
This gives you a firm foundation for decisions without betting the farm on decade-long customer behavior predictions.
When year one metrics don't tell the whole story
Clay's approach isn't perfect — no metric is. Enterprise customers, for example, have higher acquisition costs but also higher expansion rates and stickiness. The year one ratio might look worse even though these customers are more valuable long-term.
"That's always the qualitative and quantitative marrying of metrics in finance," Karan acknowledges. You still need business judgment to interpret the numbers.
But here's the key difference: you're making informed bets on shorter time horizons with more reliable data, not hoping your 10-year assumptions prove correct.
If you're using LTV assumptions, prove they're conservative by showing actual customer behavior over 2-3 years. Demonstrate positive skew by explaining how product launches or expansions will improve customer value over time.
The goal isn't to abandon all forward-looking metrics — it's to ground them in reality rather than wishful thinking.
Thinking of switching?

Start tracking both metrics for a few quarters. Calculate your traditional LTV to CAC alongside year one gross profit to CAC. See which one better predicts actual business performance and cash flow.
You might discover that your "amazing" LTV to CAC was masking some uncomfortable truths about customer acquisition efficiency. Or you might validate that your long-term assumptions are actually conservative.
Either way, you'll have a clearer picture of what's really driving your business—and that's worth more than any perfectly optimized fundraising metric.
📝 Action audit
Calculate your current year-one gross profit to CAC ratio (15 minutes). Pull last quarter's customer data and calculate gross profit (revenue minus direct costs) for your most recent cohort. Divide by CAC to see how your real payback timeline compares to LTV assumptions.
Audit your LTV assumptions for reality. Write down your LTV assumptions: customer lifespan, churn rates, expansion rates, service costs. Circle ones based on hope rather than 12+ months of actual data.
Segment your customers by acquisition channel. Pull a report showing year one revenue and CAC by channel (paid ads, referrals, enterprise sales). You'll discover massive variations — some channels pay back in months, others never.
✈️ We just launched Rippling Travel
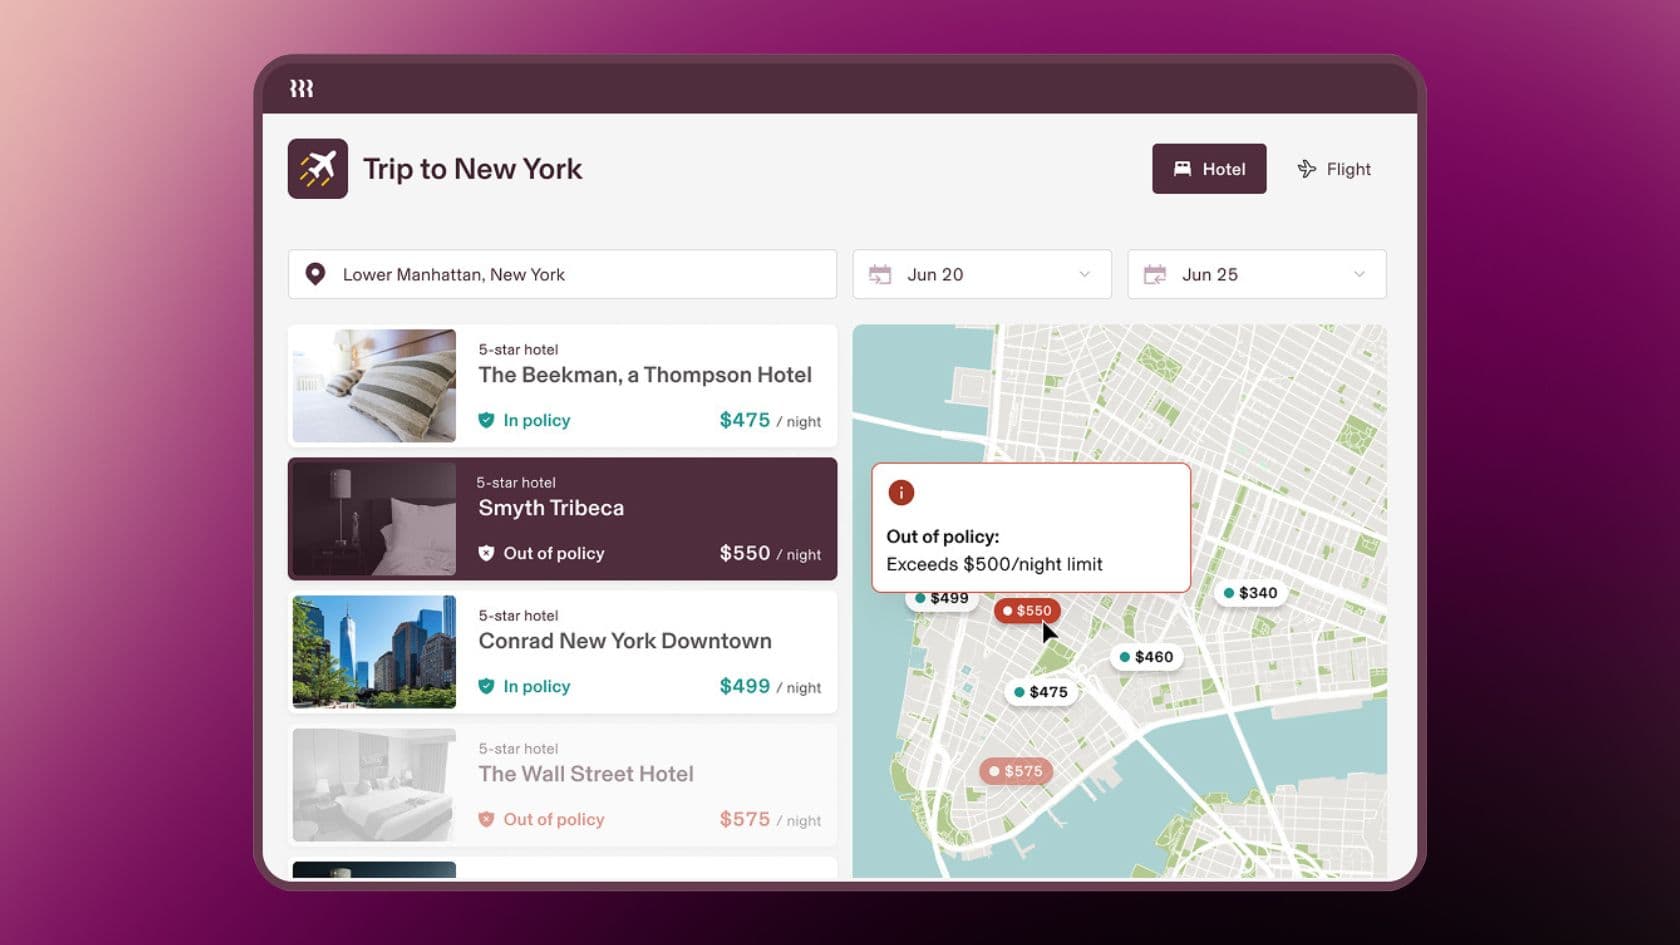
Save more time & money on business travel
Companies like Aalo Atomics are booking travel 6x faster, getting 100% employee adoption, and finally gaining control of every penny spent on travel.
Book like it’s Google flights (but with clear out-of-policy flags)
Build granular spending controls other platforms can't match
Let automated approvals take over the busy work
🔥 Hot links
Ex-OpenAI Controller shares 30-day implementation plan for AI in finance
Buffett sparks UnitedHealth's biggest stock surge in 17 years
📊 Chart of the week
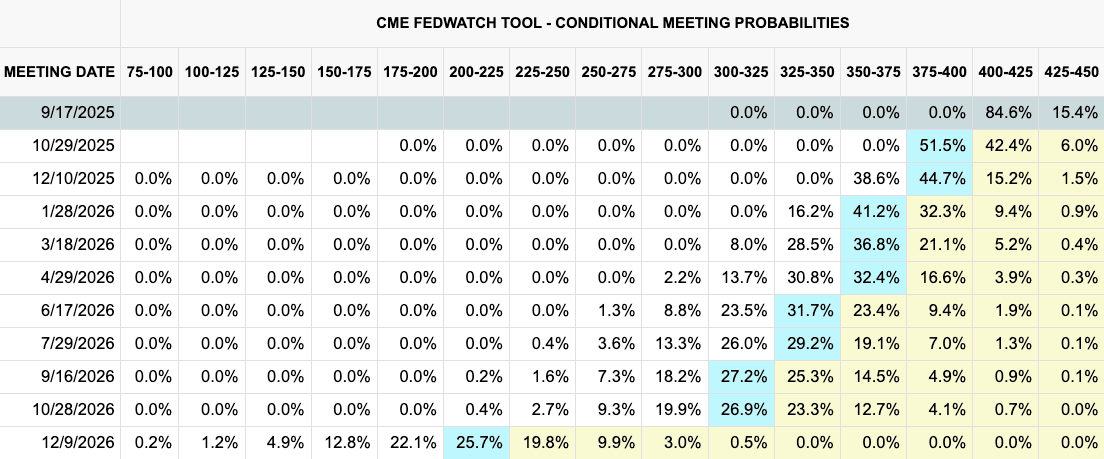
Probability of Federal Reserve rate cuts by month
Each month of new economic data is pointing toward a rate cut from the Federal Reserve, but odds dropped slightly after recent inflation data came in hotter than expected. According to CME’s Fedwatch Tool, the odds of a September 17th rate cut to 400-425 bps now stand at 84.6%.
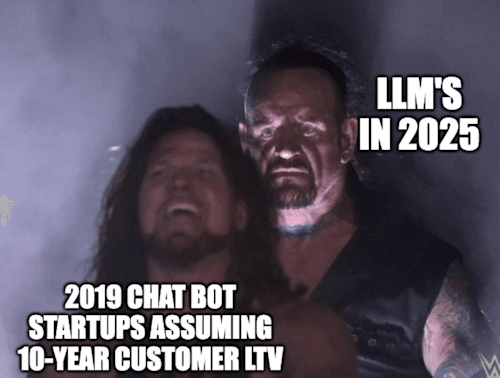
🤣 Weekly chuckle
Weitere finance-Ressourcen

Newsletter
Stop building AI for perfect conditions
Rippling’s Ankur Bhatt shares how brittle workflows break AI agents — and the frameworks teams need to ship reliable, reasoning-driven agents into production.

📋 Apply to join
Applications are reviewed weekly. Invitations are limited. that holds HR together
Apply to join the community! If you’re applying to the community to get access to an exclusive event, make sure to add the referral code so we can fast-track your acceptance and invitation.
If you’re accepted, we’ll send an email to let you know. Once accepted, your membership unlocks priority invitations to events, vetted peer discussions and premium content resources.