


Newsletter


By clicking "Apply now," you agree to the use of your data in accordance with Rippling's Privacy Notice, including for marketing purposes.
Unlock business-critical insights and delegate tedious tasks to AI built for HR, Payroll, IT, and Finance.
Learn more
Get engineer-built custom apps in Rippling to automate any business process you have.
Learn more
Employer of Record
Hire globally without entities

Global Payroll
Pay employees anywhere

Global Contractors
Pay contractors anywhere

Contractor of Record
Mitigate contractor risk

Global HRIS
Run global HR in one place

Global HR Advisor
Get localised HR expertise

Global Benefits
Manage benefits anywhere

Global Spend
Save everywhere you operate
Customer Stories

Barry’s empowers their workforce with a scalable HR solution

Forterra automates busywork to drive impact

Chess.com creates a frictionless people process

Clay grew 5x by automating 80% of its onboarding tasks
Blank Street Coffee saves 40 hours by automating open enrolment

Rippling gave Andros automation superpowers


EN
United Kingdom (EN)


Australia (EN)

Canada (EN)
Canada (FR)

France (FR)

Germany (DE)

Ireland (EN)

United States (EN)
EN
United Kingdom (EN)
Australia (EN)
Canada (EN)
Canada (FR)
France (FR)
Germany (DE)
Ireland (EN)
United States (EN)
EN
United Kingdom (EN)
Australia (EN)
Canada (EN)
Canada (FR)
France (FR)
Germany (DE)
Ireland (EN)
United States (EN)
See how Rippling’s CFO measures investment into R&D, S&M, and G&A.

Note from the author
You can't manage R&D investment the same way you manage sales spend — and most CFOs are making expensive mistakes by trying. So, in continuing with our series from Adam Swiecicki (Rippling’s CFO), we’re covering his exact framework for measuring resource allocation into R&D vs. Sales & Marketing vs. G&A.
Today’s key takeaways:
5 Steps: Resource allocation framework
Action audit: Set your G&A gearing ratio
Hot link: Lucid & Uber team up
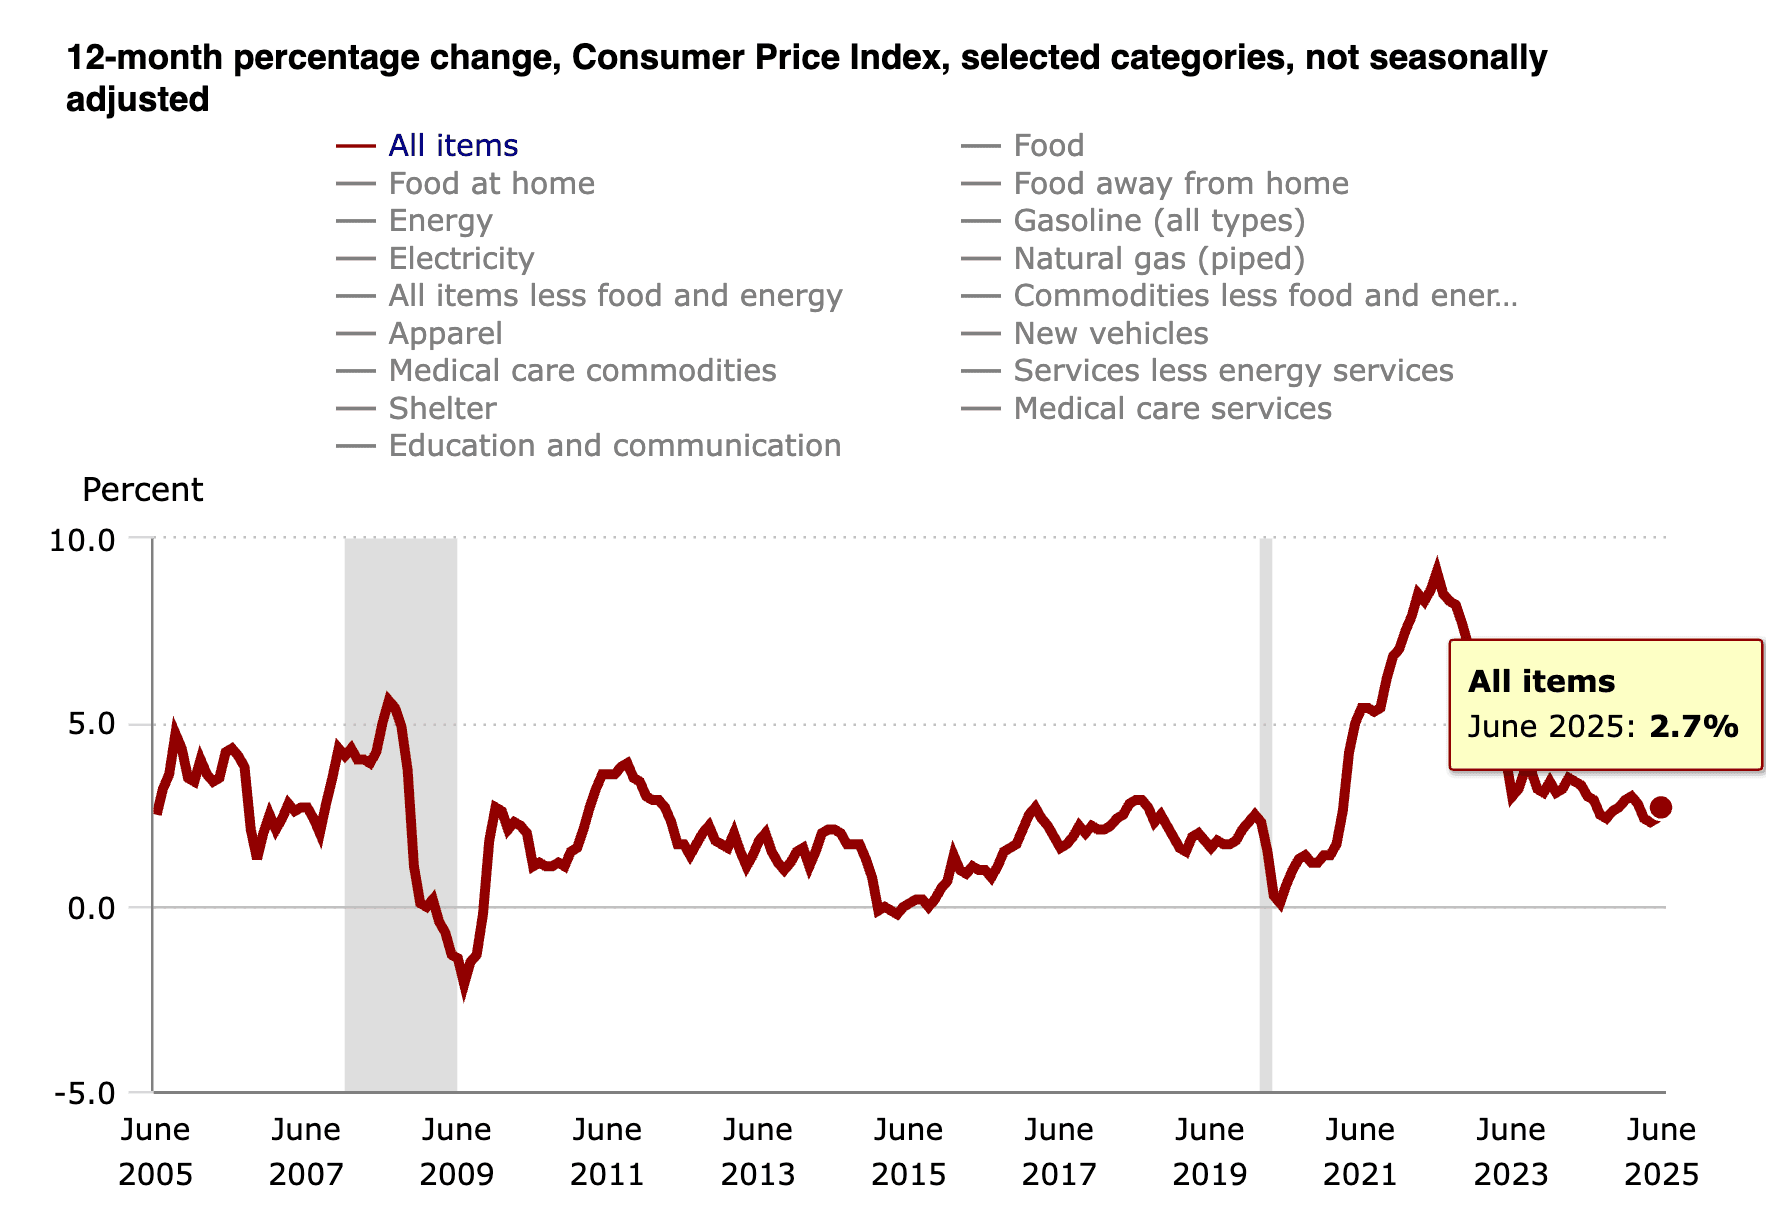
Chart: 12-month percentage change in CPI

"All burn is not created equal," Adam explains. "I look at dollar losses associated with building a product from the R&D org, which may generate revenue three to five years out...very differently relative to the cost of a salesperson or a sales motion that's very inefficient."
The critical insight: R&D spend that pays off in 3-5 years should be evaluated completely differently from sales spend that should show ROI within 18 months.
When you optimize both the same way, you either under-invest in long-term growth or over-spend on inefficient go-to-market.
Industry benchmarks for R&D spend are useful guardrails, but they miss the most important question: which products are generating the best returns?
Adam's approach: "We actually look at it by product SKU. So, Rippling has a number of products that we sell, we look at the dollar cost of that R&D team relative to that ARR that that team or the revenue that team is producing."
This product-level analysis reveals which engineering investments are paying off and which aren't. Instead of just knowing you're spending 40% of revenue on R&D (vs. industry average), you know that your payroll product generates $5 of ARR per $1 of R&D spend while your new IT product only generates $1.50.
The strategic question becomes: "Are we putting those incremental R&D dollars against the things that are growing the most within our portfolio?"
Sales and marketing should be the most measurable functions in your business because the revenue impact is direct and relatively immediate.
Adam's framework: "We think about it in terms of LTV to CAC… We target CAC paybacks under 18 months. And then if we're over that threshold, we look at how we can be more efficient."
But here's where most companies stop — they look at blended CAC payback and miss the granular insights. Adam goes deeper: "We also dive into our US sales versus international sales versus HR sales versus IT sales...at the component level to ensure that you're getting good sales efficiency across the org."
This means you might discover that your US enterprise sales team has 12-month paybacks while your international SMB motion has 24-month paybacks. The blended number looks fine, but you're actually subsidizing an inefficient international strategy with domestic success.
G&A is the easiest function to benchmark because the work is largely standardized across companies. The key is building in automatic efficiency improvements.
Adam's rule: "There's a gearing ratio, which for us the rule of thumb is if you're growing the top line X, you try to grow your G&A half of X. So you kind of mandate operating leverage and efficiency every year."
This means if revenue grows 100%, G&A should only grow 50%. If revenue grows 40%, G&A grows 20%. The forcing function prevents G&A bloat.

The most sophisticated cost management happens at the individual function level with custom ROI metrics that guide hiring decisions in real-time.
Rippling developed a "cash on cash payback for sales" metric: total cash out (headcount expenses, salary, commissions, severance) compared to cash in (revenue generated from upfront sales and monthly deals).
To learn more about this metric, download our Series B fundraising deck and read Slide 10.
"If that ratio was one or better, you had a green light to hire and you could feel comfortable about those sales reps once fully ramped generating revenue for the business."
Set up your G&A gearing ratio baseline. Calculate G&A headcount as percentage of total employees and G&A spend as percentage of revenue. Set target: if revenue grows XX%, G&A grows 0.5 * XX%. Schedule monthly tracking.
Audit your metric blind spots. Identify functions with no ROI measurement (legal, HR, facilities). Pick one and design a proxy metric to track value creation vs. cost.
Define function-specific success metrics. Set specific ROI targets: R&D should generate $X ARR per dollar spent, Sales should achieve Y-month payback, etc.
Inflation picks up again in June, rising at 2.7% annual rate
Trump asked GOP lawmakers if he should fire Fed Chair Jerome Powell


Why Clay ditched LTV:CAC (and you should too)
The SaaS metric everyone swears by has a dirty secret. Here’s one CFO's solution that actually works.
Apply to join the community! If you’re applying to the community to get access to an exclusive event, make sure to add the referral code so we can fast-track your acceptance and invitation.
If you’re accepted, we’ll send an email to let you know. Once accepted, your membership unlocks priority invitations to events, vetted peer discussions and premium content resources.
By clicking "Apply now," you agree to the use of your data in accordance with Rippling's Privacy Notice, including for marketing purposes.